Introduction
Bioinformatics is an interdisciplinary field that combines biology, computer science, mathematics, and statistics to analyze and interpret biological data. It plays a crucial role in modern biology, especially in genomics, proteomics, drug discovery, and evolutionary studies. Bioinformatics is the application of computational tools and techniques to collect, store, analyze, and visualize biological data, particularly molecular data like DNA, RNA, and proteins.
What is bioinformatics?
As you might imagine, sequencing entire genomes generates a huge volume of information. The field of bioinformatics combines biology, mathematics, computer science, and statistics to convert raw nucleotide data into the location and potential function of genes or presumed genes on sequenced genomes using a complex process called genome annotation. Once genes have been identified, bioinformaticists can perform computer or in silico analysis to further examine the genome.
What Does the Sequence Mean in bioinformatics?
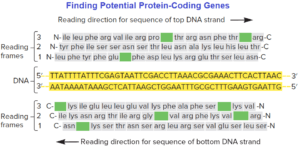
Obviously, obtaining nucleotide sequences without understanding the location and function of individual genes would be a pointless exercise. The goal of genome annotation is to identify every potential (putative) protein-coding gene as well as each rRNA and tRNA coding gene. A protein-coding gene is usually recognized as an open reading frame (ORF); to find all ORFs, both strands of DNA must be analyzed in all three reading frames.

A bacterial or archaeal ORF is generally defined as a sequence of at least 100 codons (300 base pairs) that is not interrupted by a stop codon and has terminator sequences at the 3′ end. The 5′ end of the gene should also bear a ribosome-binding site. Only if these elements are present is an ORF considered a putative protein-coding gene. This process is performed by gene prediction programs designed to find genes that encode proteins or functional RNA products. Ideally, computer-identified genes are then manually inspected by bioinformaticists to verify the computer generated gene assignments. This process is called genome curation.
ORFs that appear to encode proteins are called coding sequences (CDS). Bioinformaticists have developed algorithms to compare the sequence of predicted CDS with those in large databases containing nucleotide and amino acid sequences of known proteins. The base-by-base comparison of two or more gene sequences is called alignment. Alignments can also be performed by comparing amino acid sequences between two proteins.
Scientists most often use BLAST (basic local alignment search tool) programs to perform this task. These programs compare the nucleotide (or amino acid) sequence of interest, called the query sequence, to all other sequences entered in the database. The results (“hits”) are ranked in order of decreasing similarity. An E-value is assigned to each alignment; this value measures the possibility of obtaining the alignment by chance; thus highly homologous sequences have very low E-values.
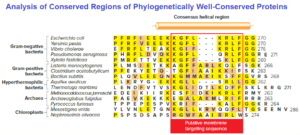
Considerable information can often be inferred from translated amino acid sequences of potential genes. Often a short pattern of amino acids, called a motif or domain, will represent a functional unit within a protein, such as the active site of an enzyme. For instance, figure shows the C-terminal domain of the cell division protein MinD from a number of microbes.

Because these amino acids are found in such a wide range of organisms, they are considered phylogenetically well conserved. In this case, the conserved region is predicted to form a coil needed for proper localization of the protein to the membrane. Finding this high level of conservation (similarity) allows the genome curator to confidently assign a function to the domain.
Genes from different organisms with such similar ORFs are called orthologues. Sometimes there appear to be
duplicated genes on the same genome. This is discovered when two or more genes have very similar nucleotide sequences. Such genes are called paralogues.
As the number of sequenced genomes has expanded, so has the need to carefully define how new genes and proteins are named. The use of a structured vocabulary is called ontology, and a standard gene ontology (GO) has been adopted as the means by which proteins, or motifs within proteins, are commonly named. This is based on the similarities of amino acid sequences among orthologous proteins. A GO term not only reflects protein function but also defines the cellular process in which the protein participates (e.g., motility) and the cellular location of the protein (e.g., flagellum).
Proteins that do not align with known amino acid sequences fall into two classes:
- Conserved hypothetical proteins are encoded by genes that have matches in the database but no function has yet been assigned to any of the sequences.
- Proteins of unknown function are the products of genes unique to that organism. On the one hand, as more genomes are published, the likelihood of finding a match in another organism is increased. But on the other hand, as more metagenomic data become available, so too does the pool of putative proteins with unknown functions (i.e., conserved hypothetical proteins).
Once all the genes have been annotated, a physical map representing the entire genome may be drawn. A physical map is typically drawn as concentric circles depicting a bacterial or archaeal chromosome with each gene described by functional class (e.g., energy metabolism), which is color coded. Deviation from the mean % G + C is often indicated an the inner circle. Such deviations are common when DNA has been acquired by horizontal gene transfer. If the microbe has multiple chromosomes or plasmids, a genome map will show each chromosome and plasmid.
Reference and Sources
- https://www.ncbi.nlm.nih.gov/books/NBK21136/
- https://quizlet.com/71004695/chapter-18-micro-flash-cards/
- https://quizlet.com/450287536/microbio-ch-18-genomics-flash-cards/
- https://www.pnas.org/content/103/34/12879
- https://europepmc.org/articles/PMC3706743
Also Read:
- Transposable Elements
- What is Gene Expression?
- Vector: properties, types and characteristics
- Second Golden Age of Microbiology
- Plasmid: Properties, Types, Replication and Organization
- Mutations: Introduction, Types, Causes and Repair Mechanisms
- Whole-Genome Shotgun Sequencing: overview, steps and achievements
- Bacteriophage: characteristics and replication of lytic and lysogenic cycle
- Tools of Genetic Engineering to Make Genome Modifications
- DNA Replication in eukaryotes: Initiation, Elongation and Termination
- Fungi: Distribution, Morphology, Reproduction, Classification

